


The price of oil “has legs,” as they say.
Running bulls are calling for another era of $100+. The last time we saw that number flicker on a quote screen was July 2014. But today’s market feels more like circa 2007. Robust oil and gas consumption tugs against reluctant production. While geopolitical tensions — think Russia, Ukraine, Middle East — act as a dark, phantom force to the upside.
The here-and-now price of a barrel has topped US$80 (WTI), which is a milestone. Any price with an 8 in front of it goes beyond mere curiosity — fiscal consequences ensue outside US$50 to US$70, the range where supply and demand are balanced. Every $10-a-barrel increase is another billion dollars a day changing hands. That’s a lot of coin going mostly into the pockets of resource owners, operators and their investors. Adding to the jingle are strong natural gas prices.
Over the past decade we’ve seen a huge build-out in renewable energy sources and great progress in pushing electric vehicles off assembly lines. Yet despite the forces of substitution, divestment and the persistent pandemic, 100 million barrels of oil are still flowing through the veins of the global economy.
Worldwide oil consumption will eventually peak and roll over. But many acknowledge that day is still several years away. Meaningful decline is unlikely until the 2030s.
So, escalating oil and gas prices remain of major consequence to Canada. Western provinces and Newfoundland and Labrador are the prime beneficiaries. Alberta dominates the share of output, with roughly 80% of all Canadian production.
The torque to higher oil and gas prices is staggering. In 2021, as commodity prices rose from the dead, Canada’s industry generated an estimated record C$158 billion of revenue. Previously, the high-water mark was C$149 billion in 2008. If oil price (WTI) averages a base case of US$73 a barrel this year, the annual Canadian sales bar could climb to C$173 billion.
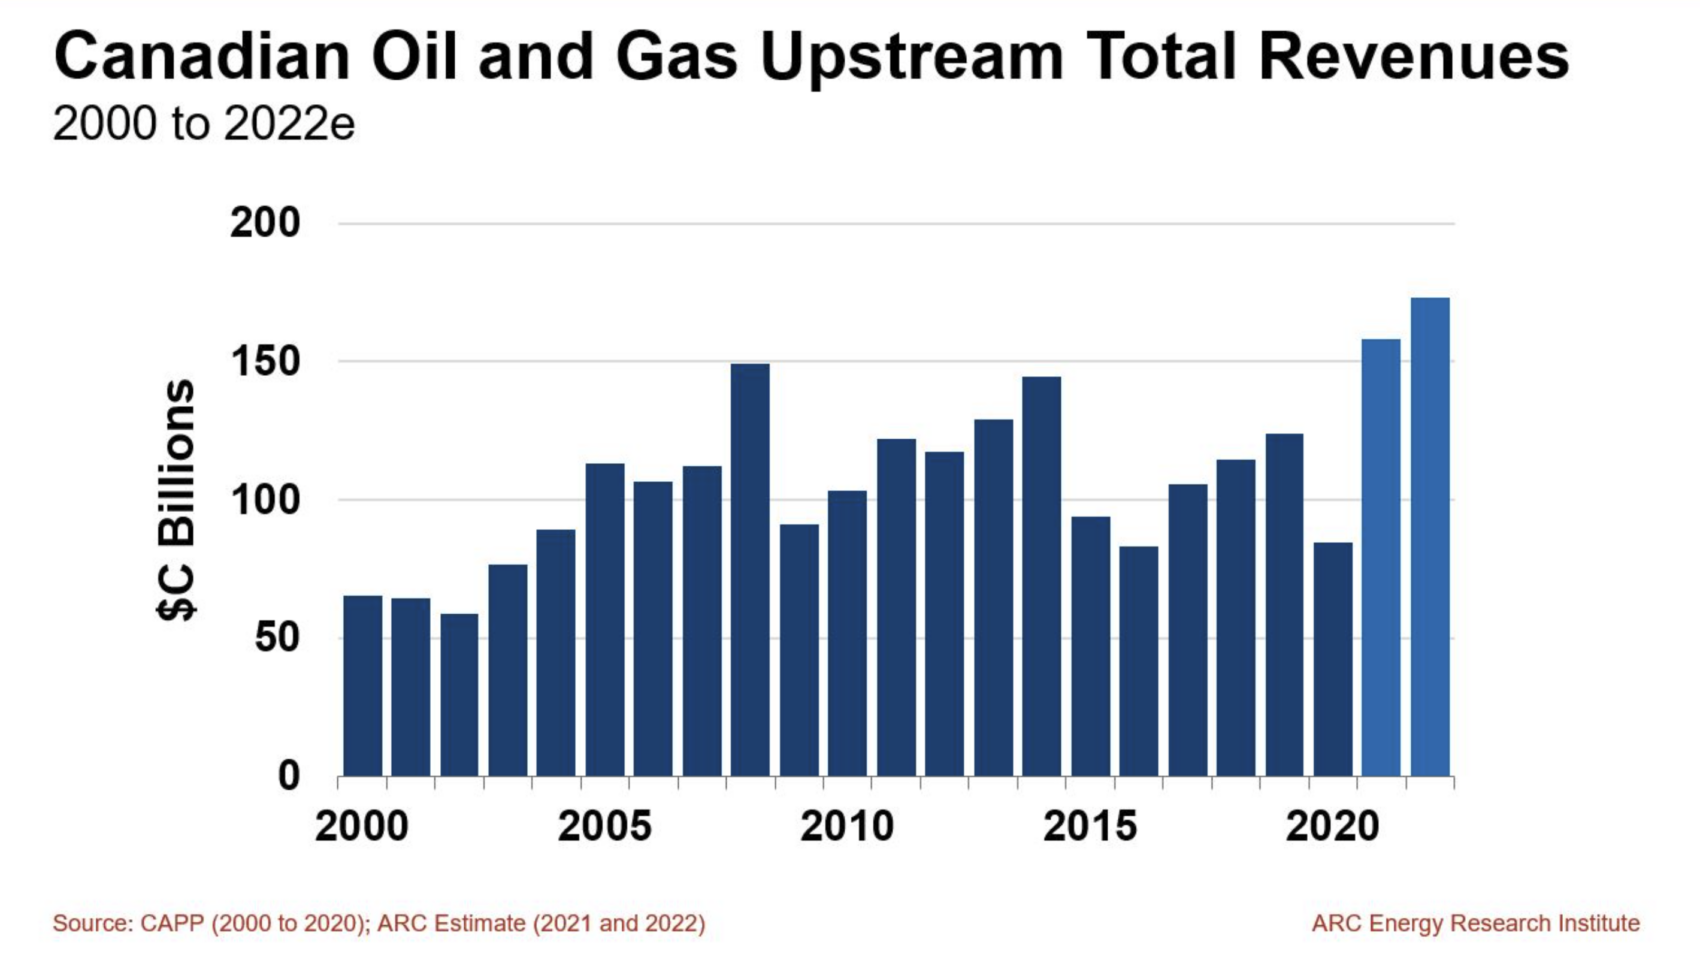
Yet, this isn’t a replay of the last oil bull run, circa 2007 to 2009. Nor is it the same as 2011 to 2014, when, post–financial crisis, robust oil prices produced industry revenues between C$110 billion and C$145 billion.
Here’s what’s different this time, with implications:
Higher output
Since 2007, combined oil and gas production in Canada has grown 35%, mostly on the back of the oil sands expansion era between 2012 and 2019. Canada now produces about 8 million barrels of oil equivalent per day, the fourth largest hydrocarbon jurisdiction in the world after Russia, Saudi Arabia and the United States.
Implication: Higher production volume expands top-line revenue, amplifying cash generation to small, upward changes in commodity prices.
Exchange rate
The last time oil was charging toward US$100/barrel, between 2006 and 2008, Canada’s loonie was a “petrodollar,” highly correlated to oil price movements. Today, the loonie treads water around 80¢ to the US dollar and is mostly deaf to the call of hydrocarbons.
Implication: If the loonie holds around 80¢ while the price of oil goes up in US dollars, producers will realize 25% greater revenue in Canadian dollars compared to the last bull run.
Market access
It’s been a while since pipelines were dinner conversation. Problems with takeaway capacity plagued much of the last decade, with 2012 to 2014 and 2018 proving to be particularly acute pinch points. Since then, pipe and rail export capacity has expanded. At the same time, production growth has substantially eased. So, for now, the grid of North American oil transport can take away Canada’s oil production without constraint.
Implication: Higher and more stable revenue. Canadian oil prices now reflect unconstrained differentials, unlike the prior decade, which was characterized by volatility and periods of steep discounts.
Lower costs
Nothing sharpens the commercial mind more than thin margins. Persistently low commodity prices over the past half dozen years, combined with pressure to reduce carbon emissions through efficiency gains, have prompted hydrocarbon producers to significantly lower their costs.
Implication: Lower costs, coupled with higher revenue, is yielding greater profitability.
Greater cash flow
Cash flow is the first-line measure of profitability. Last year was a big year at an estimated C$89 billion, compared to the previous high of C$92 billion in 2008. This year, industry cash flow could top C$100 billion for the first time.
Implications: Among the many implications, higher royalties from Alberta’s oil sands projects are notable. In the depths of the pandemic, total royalties across all provinces were less than C$4 billion. In 2021, their treasuries grew to over C$12 billion. This year, Canadian oil and gas royalties could top C$18 billion.
Shareholders are the big beneficiaries of free cash flow in this bull run. Dividends and share buybacks are attracting investors seeking cash returns, driving equity prices higher. Because of ESG and divestment pressures, the shareholder base has turned over in many oil and gas companies — this new wave of investors is reaping the reward.
Less investment
Historically, North American oil and gas companies invested all their cash flow back into the ground, drilling to add more reserves and boost production. Since about 2018, investment into output growth has required permission from investors. The new crop of shareholders has spoken: more cash, less oil and gas.
Implications: Less investment diminishes the ability of free-market oil suppliers to respond to demand for petroleum products, reinforcing expectations of higher prices. Lower capital expenditures by the industry also mean producers are more cash taxable, which adds to government coffers, both federal and provincial. However, less drilling also means that spending in rural economies, where the oil and gas fields are, is not nearly as strong as it has been in past high oil price eras.
Repatriation of influence
Perhaps the greatest change between the last bull run and now is the structure of the industry. The buyout of foreign multinational interests — for example, Statoil, Chevron, Murphy Oil, Marathon Oil, Devon, Shell, Husky and ConocoPhillips — by Canadian corporations has repatriated decision-making power around these assets into downtown Calgary. Suncor, Cenovus and Canadian Natural are the big beneficiaries of these acquisitions. Retrospectively, the foreign multinationals financed much of the oil sands expansion between 2000 and 2015, then sold the projects at losses to domestic operators.
Implication: Cash flow generated by the Canadian oil and gas industry, especially from the oil sands, is more contained. In other words, profits being generated from local resources aren’t going out the back door to foreign head offices.
As in past eras, escalating oil and gas prices will tilt the fiscal balance between producers and consumers. The ensuing inflation will challenge notions about energy security, affordability and transition.
And the price of oil isn’t even at $100.


The comparison with 2007 is compelling, especially the contrast between Canada’s 35% production growth and today’s less oil-sensitive loonie. It also highlights how even modest price changes can have major fiscal effects. For WoW Forever, comparing racial cooldowns and cast-time benefits similarly helps put headline differences into practical conte
forever racials
The comparison to 2007 feels apt, especially given how reluctant production is to respond to prices above US$80 WTI while geopolitical tensions add an upside skew. It’s striking that after a decade of renewable build-out and EV progress, 100 million barrels a day still course through the global economy, and meaningful decline likely waits until the 2030s. For Canada, the stakes are enormous: Alberta alone accounts for roughly 80% of output, and 2021’s estimated record C$158 billion in revenue surpassed the 2008 high-water mark of C$149 billion. What I find most interesting is that every $10-per-barrel move shifts a billion dollars a day, mostly to resource owners and investors, with natural gas prices adding to the jingle. Anyone wanting to sharpen their grasp of the geography behind these production centres might enjoy the region-by-region review tools at Krillion Geography alongside the broader market commentary here. The real question is whether capital discipline and substitution forces will keep this boom from repeating the excesses of the last one.
The contrast between today’s higher Canadian output and the less oil-sensitive loonie makes the new boom especially interesting. For anyone sharing charts or field images from this energy cycle, AI Metadata Remover can strip GPS, EXIF, and other embedded tags locally in the browser before publication, helping protect sensitive location and source d
ai metadata remover
Funghitown sounds like a place where odd toppings actually work, kind of like pulling still frames from video. When I need a weird source image, I use Invisible Text Copy & Paste to grab frames by interval or FPS, then download a ZIP. What’s the strangest pizza you’d defend?
Thanks for sharing this. I found the discussion around “It's a new oil boom. But it's different from the last boom.” useful, especially the practical context.
The contrast between today’s roughly 8 million barrels of Canadian oil-equivalent output and the 2007–09 boom makes the case especially clear: higher prices now amplify a much larger production base. It’s a useful reminder that this cycle has different economic stakes, even as renewables and EVs advance.
Hotel Lobby
[1084]casinok লগইন এবং অ্যাপ ডাউনলোড | বিকাশ অনলাইন ক্যাসিনো,casinok এ লগইন করুন এবং সেরা অনলাইন স্লট গেম উপভোগ করুন। বিকাশ দিয়ে অনলাইন ক্যাসিনো পেমেন্ট করে আজই আপনার অ্যাকাউন্ট তৈরি করুন। visit: casinok
https://addlinks.pro/0zf8b
[7459]Nabung77: Login Daftar Akun Slot Gacor Deposit Dana,Nabung77 memudahkan Anda daftar akun dan login untuk akses slot gacor deposit dana. Download apk slot terpercaya sekarang dan mulai mainkan game favorit Anda. visit: nabung77
The capital discipline from producers this time around really changes the dynamics compared to previous cycles. With upstream operators prioritizing share buybacks and debt reduction over aggressive drilling programs, supply isn’t going to snap back overnight just because Brent stays elevated.
I was actually putting together a visual explainer on these refining margins for a localized market brief yesterday. While testing search options around “ии видео создать” for our bilingual content workflow, I tried generating an establishing shot of an oil depot at dusk in Veo 3.1 Video Generator. The motion blur on the trucks took two tries to get right, but it gave me a usable six-second b-roll clip in under three minutes without having to dig through stale stock footage.
Congrats on getting your plumbing site live. While setting up pages for your team, you might want custom graphics. StickerFaster turns a single photo of a person, pet, or character into a full 4×3 sheet of 12 stickers, with review and crop editing before export. Handy for branded van decals or social posts.
This breakdown really clarifies why the current market dynamics feel distinct from previous cycles, especially regarding how higher output volume impacts revenue generation differently than before. While I haven’t seen the full details on the exchange rate impact yet, it makes sense that production scale now plays a bigger role than it did during the 2011 to 2014 period. It’s fascinating to see how Canada has positioned itself as the fourth largest hydrocarbon jurisdiction globally since those earlier expansions. Sometimes I just zone out trying to visualize complex data structures, which reminds me of when I used a minecraft sphere generator to get my head around geometry without getting lost in abstract math.
The section-by-section implications make this January 2022 comparison easier to assess than an oil-price headline alone. The exchange-rate and investment sections are especially useful for seeing why similar prices can produce different outcomes in different periods. I maintain RegexRegex at regex checker and value explanations that keep assumptions tied to their dates.
Thanks for sharing this. I found the discussion around “It's a new oil boom. But it's different from the last boom.” useful, especially the practical context.
Read more on vectorcraft.online
Great post, the tips here really help when you are stuck on a lyric. I have been hooked on daily music quizzes lately, and with this you can guess song in seconds thanks to the progressive clues and one second challenges. The 310 track library keeps it fresh, plus rap rounds add a nice twist.
Anesthesiology EMR quirks are real, especially around image attachments and audit trails. If you ever need to strip embedded location or device data before uploading patient images, a browser-based ai metadata remover handles EXIF, GPS, and C2PA without recompressing the file. Keeps things cleaner and more consistent with privacy expectations.
Thanks for this! Any recommended reads about wardrobe essentials?
The capital discipline from producers this cycle definitely changes the dynamic compared to the mid-2010s. Instead of wild exploration budgets chasing eighty-dollar crude, everyone seems cautious about debt and refining margins, which makes the downstream pressure feel a lot more sustained.
I was actually putting together a deck on energy transition trends for a client recently and needed quick concept visuals. I used GPT Image 2.5 to draft a few industrial mockups, and it was handy being able to adjust the pipeline labeling on one side without the rest of the layout shifting or blurring.
Finally found a site that doesn’t lag during the big wins. The interface is super smooth. Definitely give idbadai100 a try if you are looking for stability.
The loonie point is striking — a weaker dollar decoupled from oil prices means producers could realize 25% more revenue in Canadian dollars than during the last bull run. That currency dynamic, combined with unconstrained pipeline access, seems like an underappreciated reason this boom won’t rhyme with 2007–2009.
The article’s point that this boom differs because Canadian producers have already expanded takeaway capacity and cut costs is a useful corrective to the usual $100-oil nostalgia. I found the exchange-rate argument especially interesting: with the loonie near 80 cents rather than behaving like a petrodollar, producers capture roughly 25% more revenue in Canadian dollars than in the last run. The shift toward buybacks and dividends over drilling also explains why rural spending may not follow prices this time. For a lighter break from oil-market analysis, this Martin Lawrence fighting game page is a fun diversion: martin no filter fighters
At dawn: At dusk: After I dug up the skating outfit childhood still, I picked the childhood style. I pointed people to how to make the I’m so sorry trend from one photo. About two minutes for the set. Ordinary messy photos work better than perfect ones.
My spouuse and I stumblewd over her from a different
page aand thought I might aas well check things out. I like what I seee so noww i am following you.
Loook forward tto finding out about yur web pasge repeatedly.
xnxx
The framing that this isn’t a replay of the last boom is the part that sticks with me. The price headline is easy to watch, but the implications depend on what’s actually different underneath—so treating $100 as the old script would miss the point.
I use Tiny Desk AI while I read up on shifts like this, and that distinction between a headline spike and a structural change is the one I keep coming back to.
Interesting angle on how cross-links and anomalies in Telegram’s SEO graph propagate—this mirrors the messy way 3D model formats get tangled in different pipelines. Tools like 3d convert help untangle that chaos for designers, though the post’s point about link equity applies just as much to file metadata. Worth a second read.
The comparison between the current oil boom and previous cycles is really insightful, especially how production volume now amplifies revenue even with small price changes. It’s fascinating to see Canada holding fourth place globally in hydrocarbon output since the expansion era ended. I’m curious if this higher efficiency means companies can withstand volatility better than in 2014, or if they’re still chasing the same high-price targets despite structural differences. 落ち物パズル 無料
Interesting perspective on the changing energy industry! A tool to extract slides from video can also help organize insights from energy presentations.
Comparing car loan offers really does come down to reading the fine print carefully, and the jargon can be dense. I use a 文字数カウント when drafting my notes on each lender’s terms, since it shows character and line counts and keeps everything in my browser. Handy for staying organized before applying.
The distinction between higher revenue and stronger local investment is especially important here. A boom can improve producer cash flow and public royalties while still delivering less drilling activity and fewer rural economic spillovers than past cycles. That makes the distribution of gains—not just the oil price—the key question.
The article really highlights how production growth has changed the dynamics of the oil market compared to previous cycles. It’s interesting that Canada now ranks fourth globally in hydrocarbon output, which explains why even modest price increases can boost revenue significantly. The focus on exchange rates and production volume offers a fresh perspective on what might drive future profits. Enhancement Shaman talent calculator for WoW Forever makes me think about balancing different systems, much like managing resources in an industry.