


The price of oil “has legs,” as they say.
Running bulls are calling for another era of $100+. The last time we saw that number flicker on a quote screen was July 2014. But today’s market feels more like circa 2007. Robust oil and gas consumption tugs against reluctant production. While geopolitical tensions — think Russia, Ukraine, Middle East — act as a dark, phantom force to the upside.
The here-and-now price of a barrel has topped US$80 (WTI), which is a milestone. Any price with an 8 in front of it goes beyond mere curiosity — fiscal consequences ensue outside US$50 to US$70, the range where supply and demand are balanced. Every $10-a-barrel increase is another billion dollars a day changing hands. That’s a lot of coin going mostly into the pockets of resource owners, operators and their investors. Adding to the jingle are strong natural gas prices.
Over the past decade we’ve seen a huge build-out in renewable energy sources and great progress in pushing electric vehicles off assembly lines. Yet despite the forces of substitution, divestment and the persistent pandemic, 100 million barrels of oil are still flowing through the veins of the global economy.
Worldwide oil consumption will eventually peak and roll over. But many acknowledge that day is still several years away. Meaningful decline is unlikely until the 2030s.
So, escalating oil and gas prices remain of major consequence to Canada. Western provinces and Newfoundland and Labrador are the prime beneficiaries. Alberta dominates the share of output, with roughly 80% of all Canadian production.
The torque to higher oil and gas prices is staggering. In 2021, as commodity prices rose from the dead, Canada’s industry generated an estimated record C$158 billion of revenue. Previously, the high-water mark was C$149 billion in 2008. If oil price (WTI) averages a base case of US$73 a barrel this year, the annual Canadian sales bar could climb to C$173 billion.
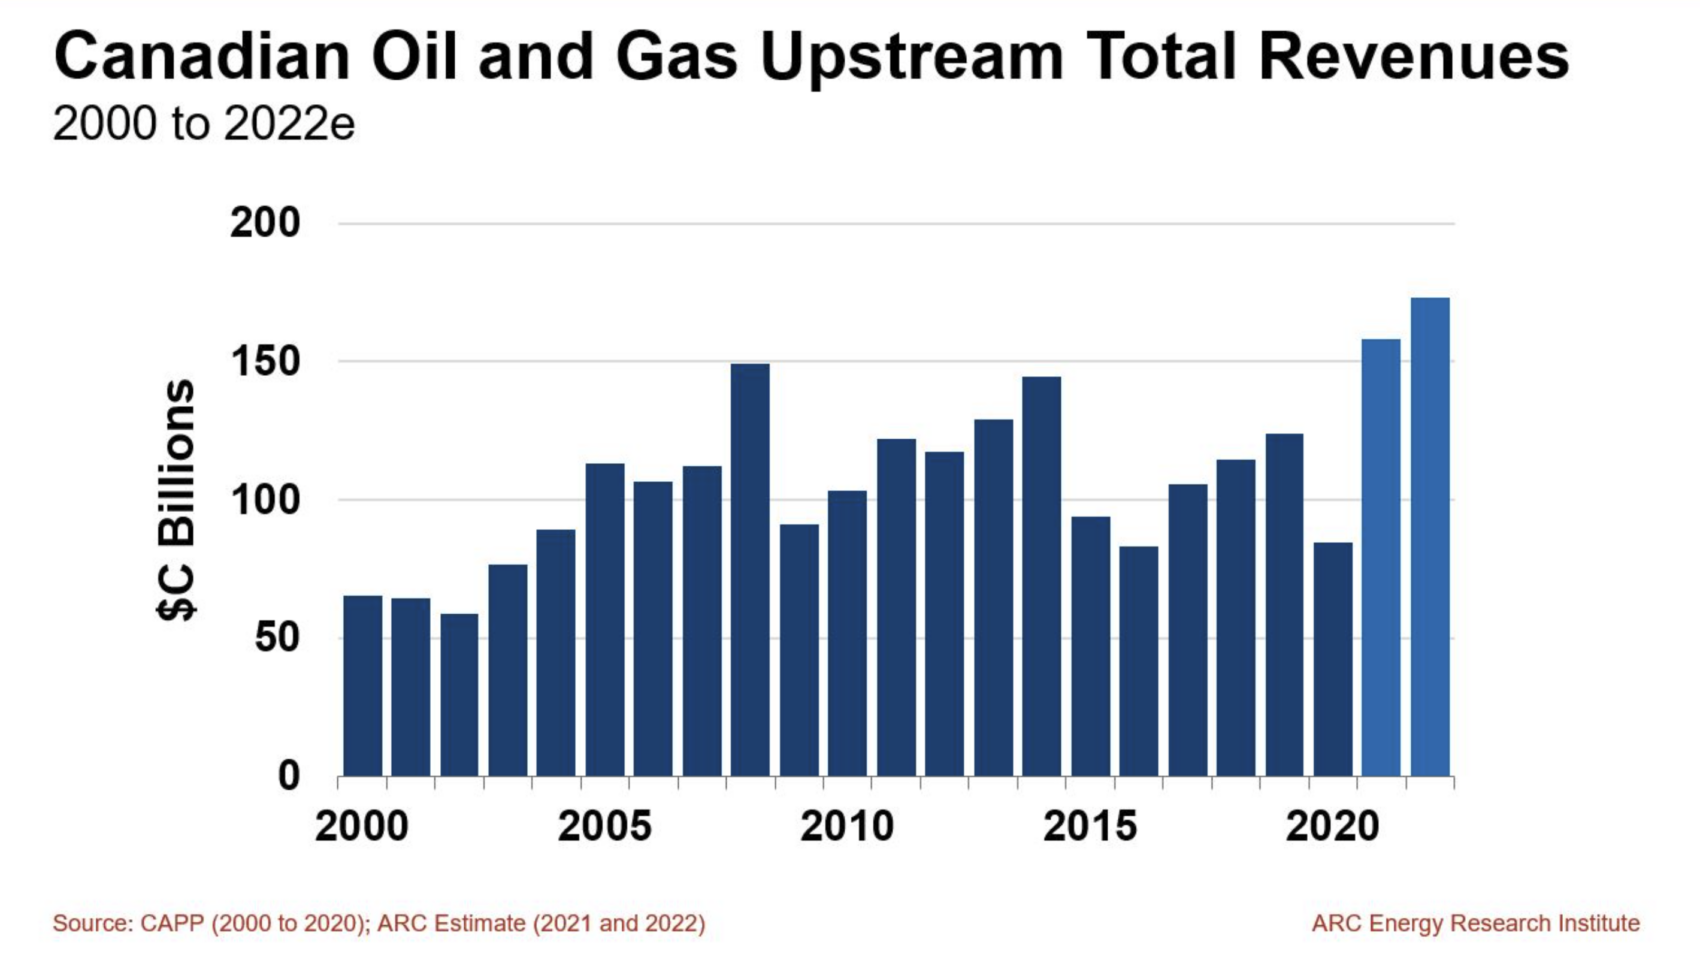
Yet, this isn’t a replay of the last oil bull run, circa 2007 to 2009. Nor is it the same as 2011 to 2014, when, post–financial crisis, robust oil prices produced industry revenues between C$110 billion and C$145 billion.
Here’s what’s different this time, with implications:
Higher output
Since 2007, combined oil and gas production in Canada has grown 35%, mostly on the back of the oil sands expansion era between 2012 and 2019. Canada now produces about 8 million barrels of oil equivalent per day, the fourth largest hydrocarbon jurisdiction in the world after Russia, Saudi Arabia and the United States.
Implication: Higher production volume expands top-line revenue, amplifying cash generation to small, upward changes in commodity prices.
Exchange rate
The last time oil was charging toward US$100/barrel, between 2006 and 2008, Canada’s loonie was a “petrodollar,” highly correlated to oil price movements. Today, the loonie treads water around 80¢ to the US dollar and is mostly deaf to the call of hydrocarbons.
Implication: If the loonie holds around 80¢ while the price of oil goes up in US dollars, producers will realize 25% greater revenue in Canadian dollars compared to the last bull run.
Market access
It’s been a while since pipelines were dinner conversation. Problems with takeaway capacity plagued much of the last decade, with 2012 to 2014 and 2018 proving to be particularly acute pinch points. Since then, pipe and rail export capacity has expanded. At the same time, production growth has substantially eased. So, for now, the grid of North American oil transport can take away Canada’s oil production without constraint.
Implication: Higher and more stable revenue. Canadian oil prices now reflect unconstrained differentials, unlike the prior decade, which was characterized by volatility and periods of steep discounts.
Lower costs
Nothing sharpens the commercial mind more than thin margins. Persistently low commodity prices over the past half dozen years, combined with pressure to reduce carbon emissions through efficiency gains, have prompted hydrocarbon producers to significantly lower their costs.
Implication: Lower costs, coupled with higher revenue, is yielding greater profitability.
Greater cash flow
Cash flow is the first-line measure of profitability. Last year was a big year at an estimated C$89 billion, compared to the previous high of C$92 billion in 2008. This year, industry cash flow could top C$100 billion for the first time.
Implications: Among the many implications, higher royalties from Alberta’s oil sands projects are notable. In the depths of the pandemic, total royalties across all provinces were less than C$4 billion. In 2021, their treasuries grew to over C$12 billion. This year, Canadian oil and gas royalties could top C$18 billion.
Shareholders are the big beneficiaries of free cash flow in this bull run. Dividends and share buybacks are attracting investors seeking cash returns, driving equity prices higher. Because of ESG and divestment pressures, the shareholder base has turned over in many oil and gas companies — this new wave of investors is reaping the reward.
Less investment
Historically, North American oil and gas companies invested all their cash flow back into the ground, drilling to add more reserves and boost production. Since about 2018, investment into output growth has required permission from investors. The new crop of shareholders has spoken: more cash, less oil and gas.
Implications: Less investment diminishes the ability of free-market oil suppliers to respond to demand for petroleum products, reinforcing expectations of higher prices. Lower capital expenditures by the industry also mean producers are more cash taxable, which adds to government coffers, both federal and provincial. However, less drilling also means that spending in rural economies, where the oil and gas fields are, is not nearly as strong as it has been in past high oil price eras.
Repatriation of influence
Perhaps the greatest change between the last bull run and now is the structure of the industry. The buyout of foreign multinational interests — for example, Statoil, Chevron, Murphy Oil, Marathon Oil, Devon, Shell, Husky and ConocoPhillips — by Canadian corporations has repatriated decision-making power around these assets into downtown Calgary. Suncor, Cenovus and Canadian Natural are the big beneficiaries of these acquisitions. Retrospectively, the foreign multinationals financed much of the oil sands expansion between 2000 and 2015, then sold the projects at losses to domestic operators.
Implication: Cash flow generated by the Canadian oil and gas industry, especially from the oil sands, is more contained. In other words, profits being generated from local resources aren’t going out the back door to foreign head offices.
As in past eras, escalating oil and gas prices will tilt the fiscal balance between producers and consumers. The ensuing inflation will challenge notions about energy security, affordability and transition.
And the price of oil isn’t even at $100.


The comparison to 2007 is especially compelling: strong consumption meeting reluctant production creates a very different setup from the previous boom. With WTI already above $80 and geopolitical tensions adding upside risk, the case for sustained $100 oil feels more credible than a temporary spike.
The distinction between higher prices and a repeat of the prior boom is well made. The sections on constrained investment, improved takeaway capacity, and the weaker loonie show why headline oil prices alone can’t explain the current cash-flow picture. It also usefully highlights the trade-off: stronger public revenues and shareholder returns, but less activity flowing into rural service economies.
The point about decision-making and cash flow staying closer to home is especially interesting; it adds useful context beyond the headline oil price. For teams trying to keep outreach organized, I also like using submify to manage product submission workflows.
Congrats on getting the site live with your first post. Since you are starting fresh, keeping things simple and easy to update is smart. When I need a quick mental break from setup tasks, I play noillirk to guess the most common answers. Looking forward to seeing what you publish next.
The distinction between production growth, market access, and lower costs makes the comparison easy to follow. For teams turning market explanations into visual demos, 01Router could be a useful place to explore video and image model access.
The contrast between production growth, market access, and pricing makes this oil boom easy to understand. For teams turning complex market stories into visual explainers, I found minimax h3 image useful for creating reference-based visuals and comparing credit costs. Thanks for the thoughtful analysis.
The discussion of how today’s energy boom differs from the previous one is thought-provoking, especially the way technology and changing demand shape the story. For teams explaining complex ideas visually, Pika H3 Flex can create videos from text, images, or reference media.
The point about the Canadian loonie staying around 80 cents while oil prices climb is really fascinating. During past booms, a stronger currency ate into those gains, but this time around, producers keep that extra margin. I wonder if this setup will push companies to invest more heavily in forecasting tools like TinyDesk AI to handle the cash flow surges.
Congrats to the first qualifiers for Asunción 2024; that kind of focus under pressure is impressive. Between events, krillion scratches a similar itch: quick trivia where rare answers win, no sign-up needed. Perfect for a mental warm-up before the next round.
The breakdown of higher output, improved market access, and lower costs makes this oil boom feel distinct from the earlier cycles. I also found the point about more decision-making and cash flow staying closer to home especially interesting. For teams turning complex market ideas into presentations, SFX v3 sound-effects guides can help add a thoughtful audio layer to a visual story. Thanks for the clear analysis.
The discussion of constrained investment and stronger cash flow is especially interesting; it shows why this oil cycle differs from 2007. I also appreciate how the post connects market access with regional outcomes. For football fans who enjoy structured comparisons, Player Sorter offers a simple way to build a personal ranking.
A really interesting look at how the energy market is changing. This oil boom is clearly different from previous cycles, especially in how companies are managing cash flow and investment. Text Compare tool.
Great insights! It’s fascinating to see how the oil industry has evolved. Higher prices are only part of the story — the bigger changes behind the scenes are just as important. RNGdle game
The article makes a convincing case that this boom is not a rerun of 2007–2009 or 2011–2014. The point about producers realizing roughly 25% more revenue in Canadian dollars if the loonie stays near 80¢ while WTI rises stood out, as did the shift toward dividends and buybacks rather than reinvesting cash flow. I wonder whether the repatriation of decision-making to Calgary will hold if prices stay high and outside capital returns. For a broader look at energy and business coverage, 极客时间ai is worth a visit.
The comparison to 2007 is compelling, especially with robust consumption meeting reluctant production rather than a simple repeat of the 2014 cycle. WTI breaking above $80, combined with geopolitical risk around Russia, Ukraine, and the Middle East, makes the case for sustained upside pressure hard to dismiss.
Thanks for sharing this. I found the discussion around “It's a new oil boom. But it's different from the last boom.” useful, especially the practical context.
More at ragdollsoccer.online
[5299]bwin লগইন করুন | বিকাশ দিয়ে স্লট ও লাইভ ক্যাসিনো গেম খেলুন,bwin লগইন করুন আর উপভোগ করুন অনলাইনে স্লট গেম খেলা। বিকাশ দিয়ে ক্যাসিনো ডিপোজিট করে লাইভ ক্যাসিনো বোনাস অফার বুঝে নিন। আজই অ্যাপ ডাউনলোড করুন। visit: bwin
The article’s point that this boom differs from 2007–2014 because of repatriated decision-making into Calgary is the most underrated observation here. I also found the exchange-rate argument convincing: with the loonie near 80 cents instead of acting like a petrodollar, producers keep far more revenue in Canadian dollars. The tension between shareholder cash returns and reduced drilling capacity to respond to demand seems like the real story for the next few years. For anyone tracking the fiscal side of this, tools366 offers practical tools that can help organize the numbers.
The piece makes a persuasive case that this boom is structurally different, and the point about the loonie staying near 80¢ while oil rises in US dollars is the detail I found most useful. I also appreciated the emphasis on shareholder returns and reduced reinvestment, since that explains why supply may stay slow to respond. The repatriation argument about Calgary gaining decision-making power is a nice counterweight to the usual foreign-ownership narrative. For a lighter take on satellite imagery, your name in landsat nasa spells names using real Landsat scenes.
The distinction regarding capital discipline is spot on. In previous cycles, rising prices immediately triggered a race to reinvest every dollar into new drilling and expanding capex, which inevitably sowed the seeds for the next oversupply slump. Today’s mandate—prioritizing balance sheet health, buybacks, and dividends over growth—fundamentally changes the supply response. Coupled with the weaker Canadian dollar amplifying US-dollar denominated revenues, producers are in a vastly different structural position than during the 2008 peak.